Public Bid Traffic Update
- PataBid

- Jul 2, 2022
- 3 min read
Updated: Jul 15, 2022
Following on several articles posted in April 2020 and June 2020 evaluating the public sector tendering traffic, we once again revisit how the public sector market has developed this year and what the key trends were from last year. This data is extracted from the PataBid public tender database that is curated by our proprietary A.I.
The values in these charts are an aggregate of all available public tenders that the PataBid system has collected. The individual sectors are not broken down at this point. With this in mind, lets move from west to east and see how several key provinces stack up!

Starting with British Columbia (BC), the overall trends between 2019 and 2020 was relatively flat though 2020 did end off lower then 2019 did. That said, the market has really warmed up in 2021! With significant climbs in Q1 & Q2 tendering activity. Towards the end of Q2 there has been a downward trend, but still well above 2019 and 2020 values in tender opportunities. This represents an impressive investment in public business opportunities across the spectrum in this province.

Moving east into Alberta (AB), 2019 and 2020 can bee seen as ending off at similar levels. Starting with 2021, there was a significant rise in tendering traffic through the end of Q1 and beginning of Q2. Towards the end of Q2, the traffic has been trending down and is heading towards more depressed levels then 2020. If the 2019 and 2020 trends are generally followed, it is likely that tendering traffic will continue shrinking in this province until the end of this year. Of note here, the overall traffic in Alberta is running roughly 30% lower then its neighbor British Columbia.

Continuing into Saskatchewan (SK), the traffic towards the end of 2020 actually picked up over the 2019 values. Given the much smaller amount of public tendering in general, this province tends to be significantly more volatile then its neighbors. The start of 2021 has been quite strong with a significant rise in tendering activity following the trends towards the end of 2020. This is cooling off however towards the end of Q2 and is likely to continue relatively flat to minor reductions in traffic as the year continues.

Jumping further into Ontario (ON), we can clearly see Ontario continues to be the economic engine in Canada with by far the largest overall tender traffic values. There was fairly significant volatility in the early quarters of 2020, however, the year ended off with some slight gains over 2019 values. That trend has shown a significant uptick in traffic in 2021 both in Q1 and and Q2. In a similar trend to the other provinces, there has been a cooling in the amount of tender traffic towards the end of Q2. The values are still well above 2020 and it will be interesting to see if this trend carries through the end of 2021.

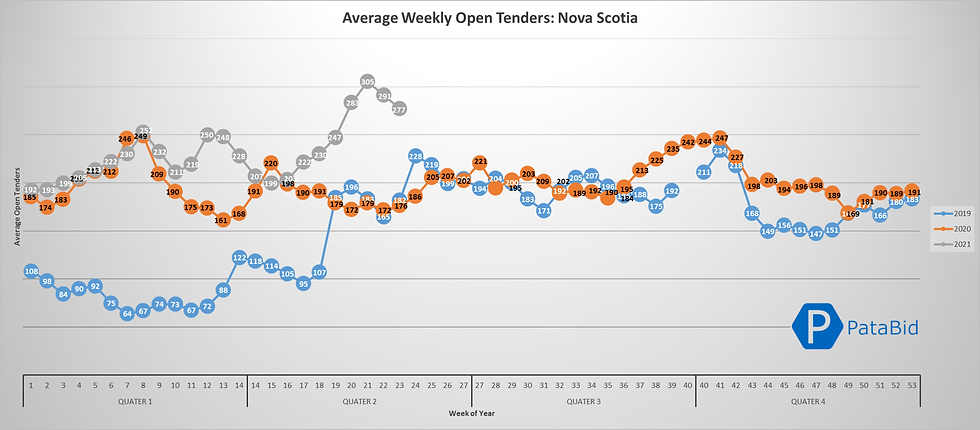
Rounding out our trip east with Nova Scotia (NS), we can clearly see that the overall values are quite low in general. One note, early values for 2019 are clearly suspect. That said, 2019 and 2020 finished off neck in neck. There was a fairly minor upswing in traffic during Q1 & Q2 similar to the other provinces, but more muted. Q2 is showing a significant spike and then downward trend. Overall traffic is likely to flatten out and return to similar levels as 2020.
Overall, the amount of traffic has indicated a growth in 2021 over both 2020 and 2019. That said, it still waits to be seen if that is a delayed "wave" caused by COVID effects in 2020 or a measurable increase in available opportunities for companies in general.
There are approximately 112,000 Canadian companies tracked in the PataBid database participating in public sector procurement. Any growth in this area represents growth opportunities for these companies so its fairly good news so far in 2021, especially for organizations targeting work in British Columbia and Ontario.
Want to never miss another public tender? Sign up for a free trial today with PataBid Tenders and let our AI find and sort tenders for you!


Comments